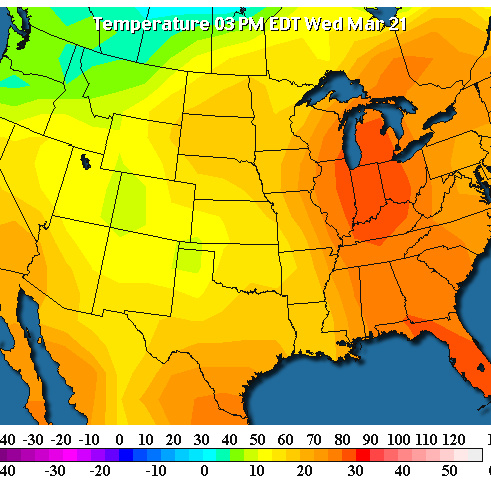
Two years ago we had a heat wave early March. This weather map above is from that heat wave. Below is a diagram of high temperatures (kind of like a tree ring) with the outermost years the latest. As you can see the March highs were in the eighties.

If you are using a non Internet Explorer browser or Internet Explorer 10 or above you can explore the weather mandala for yourself.
0 Comments